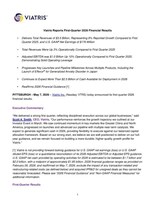
Viatris Reports First-Quarter 2026 Financial Results
PR Newswire
PITTSBURGH, May 7, 2026
- Delivers Total Revenues of $3.5 Billion, Representing 8% Reported Growth Compared to First Quarter 2025, and U.S. GAAP Net Earnings of $176 Million
- Total Revenues Were Up 3% Operationally Compared to First Quarter 2025
- Adjusted EBITDA was $1.0 Billion Up 10% Operationally Compared to First Quarter 2025, Demonstrating Solid Operating Leverage
- Progresses Key Launches and Pipeline Milestones Across Multiple Products, Including the Launch of Effexor® for Generalized Anxiety Disorder in Japan
- Continues to Expect More Than $2.5 Billion of Cash Available for Deployment in 2026
- Reaffirms 2026 Financial Guidance [1]
PITTSBURGH, May 7, 2026 /PRNewswire/ — Viatris Inc. (Nasdaq: VTRS) today announced its first-quarter 2026 financial results.
Executive Commentary
“We delivered a strong first quarter, reflecting disciplined execution across our global businesses,” said Scott A. Smith, CEO, Viatris. “Our performance reinforces the growth trajectory we outlined at our Investor Event in March. We saw continued momentum in key markets like Greater China and North America, progressed on launches and advanced our pipeline with multiple near-term catalysts. We expect to generate significant cash in 2026, providing flexibility to execute against our balanced capital allocation framework. Based on our strong start, we believe we are well positioned to deliver on our full-year guidance, and we remain focused on building a more durable, higher-quality growth profile for Viatris.”
[1] Viatris is not providing forward-looking guidance for U.S. GAAP net earnings (loss) or U.S. GAAP diluted EPS (loss) or a quantitative reconciliation of its 2026 Adjusted EBITDA or Adjusted EPS guidance. U.S. GAAP net cash provided by operating activities for 2026 is estimated to be between $1.7 billion and $2.0 billion, with a midpoint of approximately $1.85 billion. 2026 financial guidance ranges as provided on February 26, 2026, and reaffirmed on May 7, 2026, exclude the impact of any transaction-related and restructuring-related costs (as defined below) and acquired IPR&D for unsigned deals as they cannot be reasonably forecasted. Please see “2026 Financial Guidance” and “Non-GAAP Financial Measures” for additional information.
First-Quarter Results
|
Three Months Ended |
|||||||
|
March 31, |
|||||||
|
(Unaudited; in millions, except %s and per share amounts) |
2026 |
2025 |
Reported |
Operational |
|||
|
Total Revenues |
$ 3,517.0 |
$ 3,254.3 |
8 % |
3 % |
|||
|
Total Net Sales |
$ 3,509.7 |
$ 3,243.2 |
8 % |
3 % |
|||
|
Developed Markets |
2,020.8 |
1,891.7 |
7 % |
1 % |
|||
|
Emerging Markets |
535.4 |
519.9 |
3 % |
— % |
|||
|
JANZ |
273.4 |
276.1 |
(1) % |
(2) % |
|||
|
Greater China |
680.1 |
555.5 |
22 % |
18 % |
|||
|
Net Sales by Product Category |
|||||||
|
Brands |
$ 2,332.5 |
$ 2,116.9 |
10 % |
4 % |
|||
|
Generics |
1,177.2 |
1,126.3 |
5 % |
1 % |
|||
|
U.S. GAAP Gross Profit |
$ 1,157.2 |
$ 1,161.2 |
— % |
||||
|
U.S. GAAP Gross Margin |
32.9 % |
35.7 % |
|||||
|
Adjusted Gross Profit (2) |
$ 1,970.3 |
$ 1,819.6 |
8 % |
||||
|
Adjusted Gross Margin (2) |
56.0 % |
55.9 % |
|||||
|
U.S. GAAP Net Earnings (Loss) (3) |
$ 176.4 |
$ (3,042.0) |
NM |
||||
|
U.S. GAAP Earnings (Loss) Per Share (3) |
$ 0.15 |
$ (2.55) |
NM |
||||
|
Adjusted Net Earnings (2) |
$ 694.1 |
$ 600.3 |
16 % |
||||
|
Adjusted EPS (2) |
$ 0.59 |
$ 0.50 |
18 % |
14 % |
|||
|
EBITDA (2) |
$ 548.9 |
$ (2,316.8) |
NM |
||||
|
Adjusted EBITDA (2) |
$ 1,049.5 |
$ 923.5 |
14 % |
10 % |
|||
|
U.S. GAAP Net Cash Provided by Operating Activities |
$ 388.3 |
$ 535.5 |
(27) % |
||||
|
Capital Expenditures |
39.9 |
42.6 |
(6) % |
||||
|
Free Cash Flow (2)(4) |
$ 348.4 |
$ 492.9 |
(29) % |
||||
|
___________ |
|
|
(1) |
See “Certain Key Terms and Presentation Matters” in this release for more information. |
|
(2) |
Non-GAAP financial measures. See “Non-GAAP Financial Measures” for additional information. |
|
(3) |
For the three months ended March 31, 2025, includes the previously disclosed goodwill impairment charge of $2.9 billion as a result of the interim goodwill impairment test performed as of March 31, 2025. |
|
(4) |
Excluding the impact of transaction-related and restructuring-related costs of $111 million, free cash flow for the three months ended March 31, 2026, was $459 million. Excluding the impact of transaction-related costs and taxes primarily related to the divestitures of $43 million, free cash flow for the three months ended March 31, 2025, was $535 million. |
Financial Highlights for the First Quarter of 2026
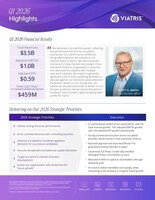
- Total revenues were $3.5 billion, up 8% on a reported basis and up 3% on an operational basis compared to first-quarter 2025 results, primarily driven by strong growth in Greater China.
- Brands net sales reflect accelerated growth in Greater China and continued strength in Emerging Markets.
- Generics net sales reflect contributions from new product launches, in addition to growth of certain products in North America, partially offset by supply constraints in our ARV business within Emerging Markets.
- The Company generated approximately $71 million in new product revenues in the quarter and continues to expect to deliver approximately $450 million to $550 million in new product revenues in 2026.
- U.S. GAAP net earnings were $176 million compared to U.S. GAAP net loss of $3.0 billion in the first quarter of 2025 and U.S. GAAP diluted EPS was $0.15 per share compared to a loss per share of $(2.55) in the first quarter of 2025. The loss in the first quarter of 2025 was primarily driven by the previously disclosed non-cash goodwill impairment charge of $2.9 billion.
- Adjusted EBITDA was $1.0 billion, up 14% on a reported basis and up 10% on an operational basis compared to the first quarter of 2025, and adjusted EPS was $0.59 per share, up 18% on a reported basis and up 14% on an operational basis compared to the first quarter of 2025.
- The Company generated U.S. GAAP net cash provided by operating activities of $388 million in the quarter and free cash flow, excluding the impact of transaction-related and restructuring-related costs, of $459 million.
Additional Highlights
- In May 2026, the Company announced that six abstracts on its investigational low dose estrogen weekly patch (150 mcg norelgestromin and 17.5 mcg ethinyl estradiol) for contraception were presented at the 2026 American College of Obstetricians and Gynecologists Annual Clinical & Scientific Meeting in Washington, D.C., May 1-3, 2026. The presentations included positive results from the previously announced Phase 3 study evaluating the contraceptive efficacy and safety of the Company’s investigational low dose estrogen weekly patch and new data on the patch’s adhesion profile under normal and under extreme conditions, as well as pharmacokinetic data and data on cycle control.
- In April 2026, the Company announced that four abstracts were presented at the American Society of Cataract and Refractive Surgery Annual Meeting in Washington, D.C., April 10-13, 2026. The presentations included data across various areas of ophthalmology, including full results from VEGA-3, a Phase 3 study evaluating MR-141 (phentolamine ophthalmic solution 0.75%) for presbyopia.
- In March 2026, the Company announced that Japan’s Ministry of Health, Labour and Welfare approved Effexor® SR 37.5 mg / 75 mg capsules (venlafaxine hydrochloride), a serotonin-noradrenaline reuptake inhibitor, for the treatment of adults with generalized anxiety disorder.
2026 Financial Guidance
Viatris is reaffirming its 2026 financial guidance ranges, as set forth below. The Company is not providing forward-looking guidance for U.S. GAAP net earnings (loss) or U.S. GAAP diluted earnings (loss) per share (EPS) or a quantitative reconciliation of its 2026 adjusted EBITDA or adjusted EPS guidance to the most directly comparable U.S. GAAP measures, U.S. GAAP net earnings (loss) or U.S. GAAP diluted EPS, respectively, because it is unable to predict with reasonable certainty the ultimate outcome of certain significant items, including integration, acquisition and divestiture-related expenses, restructuring expenses, asset impairments, litigation settlements, future share repurchases, and other contingencies, such as changes to contingent consideration, acquired IPR&D and certain other gains or losses, including for the fair value accounting impact for equity investments, as well as related income tax accounting, because certain of these items have not occurred, are out of the Company’s control and/or cannot be reasonably predicted without unreasonable effort. These items are uncertain, depend on various factors, and could have a material impact on U.S. GAAP reported results for the guidance period. With respect to the Estimated Ranges provided on February 26, 2026, and reaffirmed on May 7, 2026, U.S. GAAP net cash provided by operating activities for 2026 is estimated to be between $1.7 billion and $2.0 billion, with a midpoint of approximately $1.85 billion.
|
(In millions, except Adjusted EPS) |
Estimated Guidance |
Midpoint (2) |
|
|
Total Revenues |
$14,450 – $14,950 |
$14,700 |
|
|
Adjusted EBITDA (1) |
$4,150 – $4,450 |
$4,300 |
|
|
Adjusted EPS (1) |
$2.33 – $2.47 |
$2.40 |
|
|
Free Cash Flow (1) Excluding Transaction-related and Restructuring-related Costs |
$1,950 – $2,350 |
$2,150 |
|
(1) |
Non-GAAP financial measures. See “Non-GAAP Financial Measures” for additional information. |
|
(2) |
2026 Financial Guidance as provided on February 26, 2026, and reaffirmed on May 7, 2026, excludes any acquired IPR&D for unsigned deals to be incurred in any future period as it cannot be reasonably forecasted. |
Conference Call and Earnings Materials
As previously announced, Viatris will host a conference call and live webcast, today at 8:30 a.m. ET, to review the Company’s first-quarter 2026 financial results. Investors and the general public are invited to listen to a live webcast of the call at investor.viatris.com or by calling 844.308.3344 or 412.317.1896 for international callers. The “Viatris Q1 2026 Earnings Presentation,” which will be referenced during the call, can be found at investor.viatris.com. A replay of the webcast also will be available on the website.
About Viatris
Viatris Inc. (Nasdaq: VTRS) is a global healthcare company whose mission is to empower people worldwide to live healthier at every stage of life. We meet the needs of patients around the world by acting decisively with ingenuity and resolve. Whether we’re developing new medicines, working to maintain a resilient supply of needed therapies, or pursuing bold innovation, we strive to deliver solutions that are effective at scale and built to endure. We’re purpose-built to make an impact with a dynamic portfolio that spans generics, established brands and innovative medicines that address areas of significant unmet need. We are headquartered in the U.S., with global centers in Pittsburgh, Shanghai, China, and Hyderabad, India. Learn more at viatris.com and investor.viatris.com, and connect with us on LinkedIn, Instagram, YouTube and X.
Non-GAAP Financial Measures
This press release includes the presentation and discussion of certain financial information that differs from what is reported under accounting principles generally accepted in the United States (“U.S. GAAP”). These non-GAAP financial measures, including, but not limited to, adjusted gross profit, adjusted gross margins, adjusted net earnings, adjusted EPS, EBITDA, adjusted EBITDA, free cash flow, free cash flow excluding the impact of transaction-related and restructuring-related costs, adjusted R&D and as a % of total revenues, adjusted SG&A and as a % of total revenues, adjusted earnings from operations, adjusted interest expense, adjusted other income, net, adjusted effective tax rate, constant currency total revenues, constant currency net sales, constant currency adjusted EBITDA, and constant currency adjusted EPS, are presented in order to supplement investors’ and other readers’ understanding and assessment of the financial performance of Viatris Inc. (“Viatris” or the “Company”). Free cash flow refers to U.S. GAAP net cash provided by operating activities less capital expenditures. Management uses these measures internally for forecasting, budgeting, measuring its operating performance, and incentive-based awards. Primarily due to acquisitions, divestitures and other significant events which may impact comparability of our periodic operating results, Viatris believes that an evaluation of its ongoing operations (and comparisons of its current operations with historical and future operations) would be difficult if the disclosure of its financial results was limited to financial measures prepared only in accordance with U.S. GAAP. We believe that non-GAAP financial measures are useful supplemental information for our investors and when considered together with our U.S. GAAP financial measures and the reconciliation to the most directly comparable U.S. GAAP financial measure, provide a more complete understanding of the factors and trends affecting our operations. The financial performance of the Company is measured by senior management, in part, using adjusted metrics included herein, along with other performance metrics. In addition, the Company believes that including EBITDA and supplemental adjustments applied in presenting adjusted EBITDA is appropriate to provide additional information to investors to demonstrate the Company’s ability to comply with financial debt covenants and assess the Company’s ability to incur additional indebtedness. The Company also believes that adjusted EBITDA better focuses management on the Company’s underlying operational results and true business performance and is used, in part, for management’s incentive compensation. We also report sales performance using the non-GAAP financial measures of “constant currency”, also referred to herein as “operational change”, total revenues, net sales, adjusted EBITDA, and adjusted EPS. These measures provide information on the change in total revenues, net sales, adjusted EBITDA, and adjusted EPS assuming that foreign currency exchange rates had not changed between the prior and current period. The comparisons presented at constant currency rates reflect comparative local currency sales at the prior year’s foreign exchange rates. We routinely evaluate our net sales, total revenues, adjusted EBITDA, and adjusted EPS performance at constant currency so that sales results can be viewed without the impact of foreign currency exchange rates, thereby facilitating a period-to-period comparison of our operational activities and believe that this presentation also provides useful information to investors for the same reason. The “Summary of Total Revenues by Segment” table below compares total revenues and net sales on an actual and constant currency basis for each reportable segment for the three months ended March 31, 2026 and 2025. Also, set forth below, Viatris has provided reconciliations of such non-GAAP financial measures to the most directly comparable U.S. GAAP financial measures. Investors and other readers are encouraged to review the related U.S. GAAP financial measures and the reconciliations of the non-GAAP measures to their most directly comparable U.S. GAAP measures set forth below, and investors and other readers should consider non-GAAP measures only as supplements to, not as substitutes for or as superior measures to, the measures of financial performance prepared in accordance with U.S. GAAP. For additional information regarding the components and uses of non-GAAP financial measures refer to Management’s Discussion and Analysis of Financial Condition and Results of Operations–Use of Non-GAAP Financial Measures section of Viatris’ Quarterly Report on Form 10-Q for the three months ended March 31, 2026.
With respect to the guidance ranges as provided on February 26, 2026, at that time the Company did not provide forward-looking guidance for U.S. GAAP net earnings (loss) or U.S. GAAP diluted EPS or a quantitative reconciliation of its 2026 adjusted EBITDA or adjusted EPS guidance to the most directly comparable U.S. GAAP measures, U.S. GAAP net earnings (loss) or U.S. GAAP diluted EPS, respectively, because it was unable to predict with reasonable certainty the ultimate outcome of certain significant items, including integration, acquisition and divestiture-related expenses, restructuring expenses, asset impairments, litigation settlements, future share repurchases, and other contingencies, such as changes to contingent consideration, acquired IPR&D and certain other gains or losses, including for the fair value accounting impact for equity investments, as well as related income tax accounting, because certain of these items had not occurred, were out of the Company’s control, and/or could not be reasonably predicted without unreasonable effort. These items were uncertain, depended on various factors, and could have had a material impact on U.S. GAAP reported results for the guidance period. As previously disclosed, such guidance ranges excluded the impact of transaction-related and restructuring-related costs as well as any acquired IPR&D for unsigned deals to be incurred in any future period as it could not be reasonably forecasted. With respect to the Estimated Ranges provided as of February 26, 2026, U.S. GAAP net cash provided by operating activities for 2026 was estimated to be between $1.7 billion and $2.0 billion, with a midpoint of approximately $1.85 billion.
Certain Key Terms and Presentation Matters
New product sales, new product launches or new product revenues: Refers to revenue from new products launched in 2026 and the carryover impact of new products, including business development, launched within the last 12 months.
Operational change: Refers to constant currency percentage changes and is derived by translating amounts for the current period at prior year comparative period exchange rates and in doing so shows the percentage change from 2026 constant currency net sales, total revenues, adjusted EBITDA, and adjusted EPS to the corresponding amount in the prior year.
Transaction-related costs: Refers to the impact of any acquisition and divestiture-related transaction costs, including taxes.
Restructuring-related costs: Refers to the impact of any cash costs associated with the restructuring activities of the enterprise-wide strategic review, which are expected to be primarily related to severance and employee benefits expense, as well as other costs, including those related to contract terminations, vendor consolidations, product transfer costs and network related simplification and modernization costs.
Forward-Looking Statements
This press release contains “forward-looking statements”. These statements are made pursuant to the safe harbor provisions of the Private Securities Litigation Reform Act of 1995. Such forward-looking statements may include, without limitation, statements about our 2026 financial guidance; demonstrating solid operating leverage; progresses key launches and pipeline milestones across multiple products, including the launch of Effexor® for generalized anxiety disorder in Japan; continues to expect more than $2.5 billion of cash available for deployment in 2026; reaffirms 2026 guidance; delivered a strong first quarter, reflecting disciplined execution across our global businesses; our performance reinforces the growth trajectory we outlined at our Investor Event in March; we saw continued momentum in key markets like Greater China and North America, progressed on launches and advanced our pipeline with multiple near-term catalysts; we expect to generate significant cash in 2026, providing flexibility to execute against our balanced capital allocation framework; based on our strong start, we believe we are well positioned to deliver on our full-year guidance, and we remain focused on building a more durable, higher-quality growth profile for Viatris; continues to expect to deliver approximately $450 million to $550 million in new product revenues in 2026; the goals or outlooks with respect to the Company’s strategic initiatives and priorities, including but not limited to divestitures, acquisitions, strategic alliances, collaborations, or other potential transactions; the anticipated benefits of such strategic initiatives or priorities or restructuring activities; future opportunities for the Company and its products; the outcomes of clinical trials and research studies; R&D and new product development; and any other statements regarding the Company’s future operations, financial or operating results, capital allocation, dividend policy and payments, share repurchases, debt ratio and covenants, anticipated business levels, future earnings, planned activities, anticipated growth, market opportunities, strategies, imperatives, competitions, commitments, confidence in future results, efforts to create, enhance or otherwise unlock value, and other expectations and targets for future periods. Forward-looking statements may often be identified by the use of words such as “will”, “may”, “could”, “should”, “would”, “project”, “believe”, “anticipate”, “expect”, “plan”, “estimate”, “forecast”, “potential”, “pipeline”, “intend”, “continue”, “target”, “seek” and variations of these words or comparable words. Because forward-looking statements inherently involve risks and uncertainties, actual future results may differ materially from those expressed or implied by such forward-looking statements. Factors that could cause or contribute to such differences include, but are not limited to: the possibility that the Company may not realize the intended benefits of, or achieve the intended goals or outlooks with respect to, its strategic initiatives and priorities; the possibility that the Company may be unable to achieve the intended or expected benefits of its enterprise-wide strategic review and related cost-saving and restructuring activities within the expected timeframe or at all; the possibility that the Company may be unable to achieve intended or expected benefits in connection with divestitures, acquisitions, strategic alliances, collaborations, or other transactions, or restructuring programs, within the expected timeframes or at all; goodwill or impairment charges or other losses; success of clinical trials and the Company’s or its partners’ ability to execute on new product opportunities and develop, manufacture and commercialize products; any changes in or difficulties with the Company’s manufacturing facilities, including with respect to short- or long-term shutdowns, inspections, remediation and restructuring activities, supply chain continuity, inventory management, or the ability to meet anticipated demand; the Company’s failure to achieve expected or targeted future financial and operating performance and results; the potential impact of natural or man-made disasters, public health outbreaks, fires, accidents, weather, unrest or other emergencies in regions where we or our partners or suppliers operate; actions and decisions of healthcare and pharmaceutical regulators; changes in relevant laws, regulations and policies and/or the application or implementation thereof, including but not limited to tax, healthcare and pharmaceutical laws, regulations and policies globally; the ability to attract, motivate and retain key personnel; the Company’s liquidity, capital resources and ability to obtain financing; any regulatory, legal or other impediments to the Company’s ability to bring new products to market; products in development that receive regulatory approval may not achieve expected levels of market acceptance, efficacy or safety; longer review, response and approval times as a result of evolving regulatory priorities and reductions in personnel at health agencies; the scope, timing and outcome of any ongoing legal proceedings, including government inquiries or investigations, and the impact of any such proceedings on the Company; any significant breach of data security or data privacy or disruptions to our IT systems; risks associated with having significant operations globally; the ability to protect intellectual property and preserve intellectual property rights; changes in third-party relationships; the effect of any changes in the Company’s or its partners’ customer and supplier relationships and customer purchasing patterns, including customer loss and business disruption being greater than expected following an adverse regulatory action, acquisition or divestiture; the impacts of competition, including decreases in sales or revenues as a result of the loss of market exclusivity for certain products; changes in the economic and financial conditions of the Company or its partners; uncertainties regarding future demand, pricing and reimbursement for the Company’s products; uncertainties and matters beyond the control of management, including but not limited to general political and economic conditions, wars or other conflicts, potential for adverse impacts from future tariffs and trade restrictions, inflation rates and global exchange rates; and inherent uncertainties involved in the estimates and judgments used in the preparation of financial statements, and the providing of estimates of financial measures, in accordance with U.S. GAAP and related standards or on an adjusted basis. For more detailed information on the risks and uncertainties associated with Viatris, see the risks described in Part I, Item 1A of the Company’s Annual Report on Form 10-K for the year ended December 31, 2025, and our other filings with the SEC. You can access Viatris’ filings with the SEC through the SEC website at www.sec.gov or through our website, and Viatris strongly encourages you to do so. Viatris routinely posts information that may be important to investors on our website at investor.viatris.com, and we use this website address as a means of disclosing material information to the public in a broad, non-exclusionary manner for purposes of the SEC’s Regulation Fair Disclosure (Reg FD). The contents of our website are not incorporated into this press release or our filings with the SEC. Viatris undertakes no obligation to update any statements herein for revisions or changes after the date of this press release other than as required by law.
|
Viatris Inc. and Subsidiaries Condensed Consolidated Statements of Operations (Unaudited) |
|||
|
Three Months Ended |
|||
|
March 31, |
|||
|
(In millions, except per share amounts) |
2026 |
2025 |
|
|
Revenues: |
|||
|
Net sales |
$ 3,509.7 |
$ 3,243.2 |
|
|
Other revenues |
7.3 |
11.1 |
|
|
Total revenues |
3,517.0 |
3,254.3 |
|
|
Cost of sales |
2,359.8 |
2,093.1 |
|
|
Gross profit |
1,157.2 |
1,161.2 |
|
|
Operating expenses: |
|||
|
Research and development |
248.6 |
222.0 |
|
|
Acquired IPR&D |
6.0 |
10.0 |
|
|
Selling, general and administrative |
928.8 |
948.1 |
|
|
Impairment of goodwill |
— |
2,936.8 |
|
|
Litigation settlements and other contingencies, net |
53.5 |
(73.5) |
|
|
Total operating expenses |
1,236.9 |
4,043.4 |
|
|
Loss from operations |
(79.7) |
(2,882.2) |
|
|
Interest expense |
120.1 |
115.5 |
|
|
Other expense, net |
47.5 |
99.3 |
|
|
Loss before income taxes |
(247.3) |
(3,097.0) |
|
|
Income tax benefit |
(423.7) |
(55.0) |
|
|
Net earnings (loss) |
$ 176.4 |
$ (3,042.0) |
|
|
Earnings (loss) per share attributable to Viatris Inc. shareholders |
|||
|
Basic |
$ 0.15 |
$ (2.55) |
|
|
Diluted |
$ 0.15 |
$ (2.55) |
|
|
Weighted average shares outstanding: |
|||
|
Basic |
1,155.4 |
1,192.4 |
|
|
Diluted |
1,175.3 |
1,192.4 |
|
|
Viatris Inc. and Subsidiaries Condensed Consolidated Balance Sheets (Unaudited) |
|||
|
(In millions) |
March 31, |
December 31, |
|
|
ASSETS |
|||
|
Assets |
|||
|
Current assets: |
|||
|
Cash and cash equivalents |
$ 1,804.2 |
$ 1,322.4 |
|
|
Accounts receivable, net |
3,076.3 |
3,031.3 |
|
|
Inventories |
3,927.0 |
3,999.2 |
|
|
Prepaid expenses and other current assets |
2,109.3 |
1,436.3 |
|
|
Total current assets |
10,916.8 |
9,789.2 |
|
|
Intangible assets, net |
14,482.3 |
15,102.1 |
|
|
Goodwill |
6,692.4 |
6,754.7 |
|
|
Other non-current assets |
4,743.1 |
5,547.1 |
|
|
Total assets |
$ 36,834.6 |
$ 37,193.1 |
|
|
LIABILITIES AND EQUITY |
|||
|
Liabilities |
|||
|
Current portion of long-term debt and other long-term obligations |
$ 1,931.1 |
$ 1,933.3 |
|
|
Other current liabilities |
4,879.2 |
5,161.0 |
|
|
Long-term debt |
12,413.5 |
12,480.6 |
|
|
Other non-current liabilities |
2,953.1 |
2,906.9 |
|
|
Total liabilities |
22,176.9 |
22,481.8 |
|
|
Shareholders’ equity |
14,657.7 |
14,711.3 |
|
|
Total liabilities and equity |
$ 36,834.6 |
$ 37,193.1 |
|
|
Viatris Inc. and Subsidiaries Key Product Net Sales, on a Consolidated Basis (Unaudited) |
||||
|
Three months ended March 31, |
||||
|
(In millions) |
2026 |
2025 |
||
|
Select Key Global Products |
||||
|
Lipitor ® |
$ 462.0 |
$ 388.0 |
||
|
Norvasc ® |
210.0 |
172.3 |
||
|
Lyrica ® |
120.6 |
112.6 |
||
|
EpiPen® Auto-Injectors |
101.1 |
96.7 |
||
|
Creon ® |
97.4 |
82.4 |
||
|
Viagra ® |
95.0 |
98.5 |
||
|
Zoloft ® |
72.6 |
60.2 |
||
|
Celebrex ® |
67.1 |
63.4 |
||
|
Effexor ® |
62.0 |
59.3 |
||
|
Xalabrands |
39.2 |
37.1 |
||
|
Select Key Segment Products |
||||
|
Yupelri ® |
$ 62.5 |
$ 58.3 |
||
|
Dymista ® |
37.3 |
42.8 |
||
|
Xanax ® |
34.8 |
32.3 |
||
|
Amitiza ® |
34.0 |
33.3 |
||
|
____________ |
|
|
(a) |
The Company does not disclose net sales for any products considered competitively sensitive. |
|
(b) |
Products disclosed may change in future periods, including as a result of seasonality, competition or new product launches. |
|
(c) |
Amounts include the impact of foreign currency fluctuations compared to the prior year period. |
Viatris Inc. and Subsidiaries
Reconciliation of Non-GAAP Financial Measures
(Unaudited)
Reconciliation of U.S. GAAP Net Earnings (Loss) to Adjusted Net Earnings and U.S. GAAP Earnings (Loss) Per Share to Adjusted EPS
Below is a reconciliation of U.S. GAAP net earnings (loss) and diluted earnings (loss) per share to adjusted net earnings and adjusted EPS for the three months ended March 31, 2026, compared to the prior year period:
|
Three Months Ended March 31, |
|||||||
|
(In millions, except per share amounts) |
2026 |
2025 |
|||||
|
U.S. GAAP net earnings (loss) and U.S. GAAP diluted earnings (loss) per share |
$ 176.4 |
$ 0.15 |
$ (3,042.0) |
$ (2.55) |
|||
|
Purchase accounting amortization (primarily included in cost of sales) |
591.5 |
583.5 |
|||||
|
Impairment of goodwill |
— |
2,936.8 |
|||||
|
Litigation settlements and other contingencies, net |
53.5 |
(73.5) |
|||||
|
Interest expense (primarily amortization of premiums and discounts on long term |
(10.1) |
(9.2) |
|||||
|
Loss on divestitures of businesses (included in other expense, net) |
13.9 |
36.9 |
|||||
|
Acquisition and divestiture-related costs (primarily included in cost of sales and |
62.3 |
40.7 |
|||||
|
Restructuring costs (b) |
92.5 |
92.9 |
|||||
|
Share-based compensation expense |
48.2 |
55.2 |
|||||
|
Other special items included in: |
|||||||
|
Cost of sales (c) |
142.4 |
41.6 |
|||||
|
Research and development expense |
2.8 |
0.7 |
|||||
|
Selling, general and administrative expense |
35.4 |
17.6 |
|||||
|
Other expense, net (d) |
61.3 |
101.4 |
|||||
|
Tax effect of the above items and other income tax related items (e) |
(576.0) |
(182.3) |
|||||
|
Adjusted net earnings and adjusted EPS |
$ 694.1 |
$ 0.59 |
$ 600.3 |
$ 0.50 |
|||
|
Weighted average diluted shares outstanding |
1,175.3 |
1,203.0 |
|||||
|
____________ |
||
|
Significant items include the following: |
||
|
(a) |
Acquisition and divestiture-related costs consist primarily of contractual obligations related to divestitures, transaction costs including legal and consulting fees, and integration activities. |
|
|
(b) |
For the three months ended March 31, 2026, charges include approximately $49.8 million in cost of sales, approximately $0.6 million in R&D, and approximately $42.0 million in SG&A, primarily relating to the 2026 restructuring program. |
|
|
(c) |
For the three months ended March 31, 2026, includes certain asset impairments, contractual termination costs, and incremental manufacturing variances and certain remediation costs at plants slated for sale or closure or undergoing remediation activities of approximately $130.7 million, including $71.9 million related to the write off inventory and fixed assets damaged in the fire at the Nashik manufacturing facility and incremental manufacturing variances. |
|
|
(d) |
For the three months ended March 31, 2026, charges include a loss of approximately $64.9 million as a result of changes in the fair value of the Biocon Limited equity shares. |
|
|
(e) |
Adjusted for changes for uncertain tax positions. |
|
Reconciliation of U.S. GAAP Net Earnings (Loss) to EBITDA and Adjusted EBITDA
Below is a reconciliation of U.S. GAAP net earnings (loss) to EBITDA and adjusted EBITDA for the three months ended March 31, 2026, compared to the prior year period:
|
Three Months Ended |
|||
|
March 31, |
|||
|
(In millions) |
2026 |
2025 |
|
|
U.S. GAAP net earnings (loss) |
$ 176.4 |
$ (3,042.0) |
|
|
Add / (deduct) adjustments: |
|||
|
Income tax benefit |
(423.7) |
(55.0) |
|
|
Interest expense (a) |
120.1 |
115.5 |
|
|
Depreciation and amortization (b) |
676.1 |
664.7 |
|
|
EBITDA |
$ 548.9 |
$ (2,316.8) |
|
|
Add / (deduct) adjustments: |
|||
|
Share-based compensation expense |
48.2 |
55.2 |
|
|
Litigation settlements and other contingencies, net |
53.5 |
(73.5) |
|
|
Loss on divestitures of businesses |
13.9 |
36.9 |
|
|
Impairment of goodwill |
— |
2,936.8 |
|
|
Restructuring, acquisition and divestiture-related and other special items (c) |
385.0 |
284.9 |
|
|
Adjusted EBITDA |
$ 1,049.5 |
$ 923.5 |
|
|
____________ |
|
|
(a) |
Includes amortization of premiums and discounts on long-term debt. |
|
(b) |
Includes purchase accounting related amortization. |
|
(c) |
See items detailed in the Reconciliation of U.S. GAAP Net Earnings (Loss) to Adjusted Net Earnings. |
Summary of Total Revenues by Segment
|
Three Months Ended |
|||||||||||
|
March 31, |
|||||||||||
|
(In millions, except %s) |
2026 |
2025 |
% |
2026 |
2026 |
Constant |
|||||
|
Net sales |
|||||||||||
|
Developed Markets |
$ 2,020.8 |
$ 1,891.7 |
7 % |
$ (117.7) |
$ 1,903.1 |
1 % |
|||||
|
Greater China |
680.1 |
555.5 |
22 % |
(25.6) |
654.5 |
18 % |
|||||
|
JANZ |
273.4 |
276.1 |
(1) % |
(3.9) |
269.5 |
(2) % |
|||||
|
Emerging Markets |
535.4 |
519.9 |
3 % |
(14.6) |
520.8 |
— % |
|||||
|
Total net sales |
$ 3,509.7 |
$ 3,243.2 |
8 % |
$ (161.8) |
$ 3,347.9 |
3 % |
|||||
|
Other revenues (3) |
7.3 |
11.1 |
NM |
(0.2) |
7.1 |
NM |
|||||
|
Consolidated total revenues (4) |
$ 3,517.0 |
$ 3,254.3 |
8 % |
$ (162.0) |
$ 3,355.0 |
3 % |
|||||
|
____________ |
|
|
(1) |
Currency impact is shown as unfavorable (favorable). |
|
(2) |
The constant currency percentage change is derived by translating net sales or revenues for the current period at prior year comparative period exchange rates, and in doing so shows the percentage change from 2026 constant currency net sales or revenues to the corresponding amount in the prior year. |
|
(3) |
For the three months ended March 31, 2026, other revenues in Developed Markets, JANZ, and Emerging Markets were approximately $5.2 million, $0.1 million, and $2.0 million, respectively. |
|
(4) |
Amounts exclude intersegment revenue which eliminates on a consolidated basis. |
|
Reconciliation of Statements of Operations Line Items |
|||
|
(Unaudited) |
|||
|
Three Months Ended |
|||
|
March 31, |
|||
|
(In millions, except %s) |
2026 |
2025 |
|
|
U.S. GAAP cost of sales |
$ 2,359.8 |
$ 2,093.1 |
|
|
Deduct: |
|||
|
Purchase accounting amortization and other related items |
(591.5) |
(583.5) |
|
|
Acquisition and divestiture-related costs |
(28.4) |
(12.2) |
|
|
Restructuring costs |
(49.8) |
(19.8) |
|
|
Share-based compensation expense |
(1.0) |
(1.3) |
|
|
Other special items, including restructuring related costs |
(142.4) |
(41.6) |
|
|
Adjusted cost of sales |
$ 1,546.7 |
$ 1,434.7 |
|
|
Adjusted gross profit (a) |
$ 1,970.3 |
$ 1,819.6 |
|
|
Adjusted gross margin (a) |
56 % |
56 % |
|
|
Three Months Ended |
|||
|
March 31, |
|||
|
(In millions, except %s) |
2026 |
2025 |
|
|
U.S. GAAP R&D |
$ 248.6 |
$ 222.0 |
|
|
Deduct: |
|||
|
Acquisition and divestiture-related costs |
(2.0) |
(0.7) |
|
|
Restructuring costs |
(0.6) |
(0.8) |
|
|
Share-based compensation expense |
(2.7) |
(2.3) |
|
|
Other special items |
(2.8) |
(0.7) |
|
|
Adjusted R&D |
$ 240.5 |
$ 217.5 |
|
|
Adjusted R&D as % of total revenues |
7 % |
7 % |
|
|
Three Months Ended |
|||
|
March 31, |
|||
|
(In millions, except %s) |
2026 |
2025 |
|
|
U.S. GAAP SG&A |
$ 928.8 |
$ 948.1 |
|
|
Deduct: |
|||
|
Acquisition and divestiture-related costs |
(32.0) |
(27.8) |
|
|
Restructuring costs |
(42.0) |
(72.3) |
|
|
Share-based compensation expense |
(44.5) |
(51.7) |
|
|
Other special items and reclassifications |
(35.4) |
(17.6) |
|
|
Adjusted SG&A |
$ 774.9 |
$ 778.7 |
|
|
Adjusted SG&A as % of total revenues |
22 % |
24 % |
|
|
Three Months Ended |
|||
|
March 31, |
|||
|
(In millions) |
2026 |
2025 |
|
|
U.S. GAAP total operating expenses |
$ 1,236.9 |
$ 4,043.4 |
|
|
Add / (Deduct): |
|||
|
Litigation settlements and other contingencies, net |
(53.5) |
73.5 |
|
|
R&D adjustments |
(8.1) |
(4.5) |
|
|
SG&A adjustments |
(153.9) |
(169.4) |
|
|
Impairment of goodwill adjustments |
— |
(2,936.8) |
|
|
Adjusted total operating expenses |
$ 1,021.4 |
$ 1,006.2 |
|
|
Adjusted earnings from operations (b) |
$ 948.9 |
$ 813.4 |
|
|
Three Months Ended |
|||
|
March 31, |
|||
|
(In millions) |
2026 |
2025 |
|
|
U.S. GAAP interest expense |
$ 120.1 |
$ 115.5 |
|
|
Add / (Deduct): |
|||
|
Accretion of contingent consideration liability |
(0.9) |
(1.2) |
|
|
Amortization of premiums and discounts on long-term debt |
11.8 |
11.0 |
|
|
Other special items |
(0.7) |
(0.6) |
|
|
Adjusted interest expense |
$ 130.3 |
$ 124.7 |
|
|
Three Months Ended |
|||
|
March 31, |
|||
|
(In millions) |
2026 |
2025 |
|
|
U.S. GAAP other expense, net |
$ 47.5 |
$ 99.3 |
|
|
Add / (Deduct): |
|||
|
Fair value adjustments on non-marketable equity investments |
— |
(115.8) |
|
|
Fair value adjustments on marketable equity investments |
(64.9) |
— |
|
|
Loss on divestitures of businesses |
(13.9) |
(36.9) |
|
|
Other items |
3.7 |
14.4 |
|
|
Adjusted other income, net |
$ (27.6) |
$ (39.0) |
|
|
Three Months Ended |
|||
|
March 31, |
|||
|
(In millions, except %s) |
2026 |
2025 |
|
|
U.S. GAAP loss before income taxes |
$ (247.3) |
$ (3,097.0) |
|
|
Total pre-tax non-GAAP adjustments |
1,093.7 |
3,824.7 |
|
|
Adjusted earnings before income taxes |
$ 846.4 |
$ 727.7 |
|
|
U.S. GAAP income tax benefit |
$ (423.7) |
$ (55.0) |
|
|
Adjusted tax expense |
576.0 |
182.3 |
|
|
Adjusted income tax provision |
$ 152.3 |
$ 127.3 |
|
|
Adjusted effective tax rate |
18.0 % |
17.5 % |
|
|
___________ |
|
|
(a) |
U.S. GAAP gross profit is calculated as total revenues less U.S. GAAP cost of sales. U.S. GAAP gross margin is calculated as U.S. GAAP gross profit divided by total revenues. Adjusted gross profit is calculated as total revenues less adjusted cost of sales. Adjusted gross margin is calculated as adjusted gross profit divided by total revenues. |
|
(b) |
U.S. GAAP earnings from operations is calculated as U.S. GAAP gross profit less U.S. GAAP total operating expenses. Adjusted earnings from operations is calculated as adjusted gross profit less adjusted total operating expenses. |
|
Reconciliation of Estimated 2026 U.S. GAAP Net Cash Provided by Operating Activities to Free Cash Flow as of February 26, 2026, and May 7, 2026 |
|
|
(Unaudited) |
|
|
A reconciliation of the estimated 2026 U.S. GAAP Net Cash provided by Operating Activities to Free Cash Flow is presented below: |
|
|
(In millions) |
|
|
Estimated U.S. GAAP Net Cash provided by Operating Activities |
$1,700 – $2,000 |
|
Less: Capital Expenditures |
$(350) – $(450) |
|
Free Cash Flow |
$1,250 – $1,650 |
|
Add: Estimated Transaction-related and Restructuring-related Costs |
~$700 |
|
Free Cash Flow Excluding Transaction-related and Restructuring-related Costs |
$1,950 – $2,350 |
![]()
![]() View original content to download multimedia:https://www.prnewswire.com/news-releases/viatris-reports-first-quarter-2026-financial-results-302765461.html
View original content to download multimedia:https://www.prnewswire.com/news-releases/viatris-reports-first-quarter-2026-financial-results-302765461.html
SOURCE Viatris Inc.
